LachlanDeakin
PhD Student
Australian National University
Department of Applied Mathematics
Biography
Currently I work on GPU-accelerated volumetric image visualisation and analysis as well as the alignment of volumetric images to physical objects. In the past I developed tools for the analysis of massive (100GB+) volumetric images (e.g. property extraction, classification) for FEI and Thermo Fisher Scientific. My educational background is in robotics and computer vision which I have applied in projects such as the 2016 Amazon Picking Challenge.
Education
- Mechatronic systems
- Electronic and communication systems
Employment
Volume Rendering
- Open-source accelerated volume renderer
- Acceleration via state-of-the-art empty space skipping
- Upcoming volume renderer
- Real-time streaming to AR HMDs
- Real-time volumetric image alignment
- Unreal Engine plugin
Publications and Major Works
Authors: Deakin L, Knackstedt M
link pdf video codeAbstract (217 words)
Volume and isosurface rendering are methods of projecting volumetric images to two dimensions for visualisation. These methods are common in medical imaging and scientific visualisation.
Head-mounted optical see-through displays have recently become an affordable technology and are a promising platform for volumetric image visualisation. Images displayed on a head-mounted display must be presented at a high frame rate and with low latency to compensate for head motion. High latency can be jarring and may cause cybersickness which has similar symptoms to motion sickness.
Volumetric images can be very computationally expensive to render as they often have hundreds of millions of scalar values. Fortunately, certain materials in images such as air surrounding an object boundary are often made transparent and need not be sampled, which improves rendering efficiency.
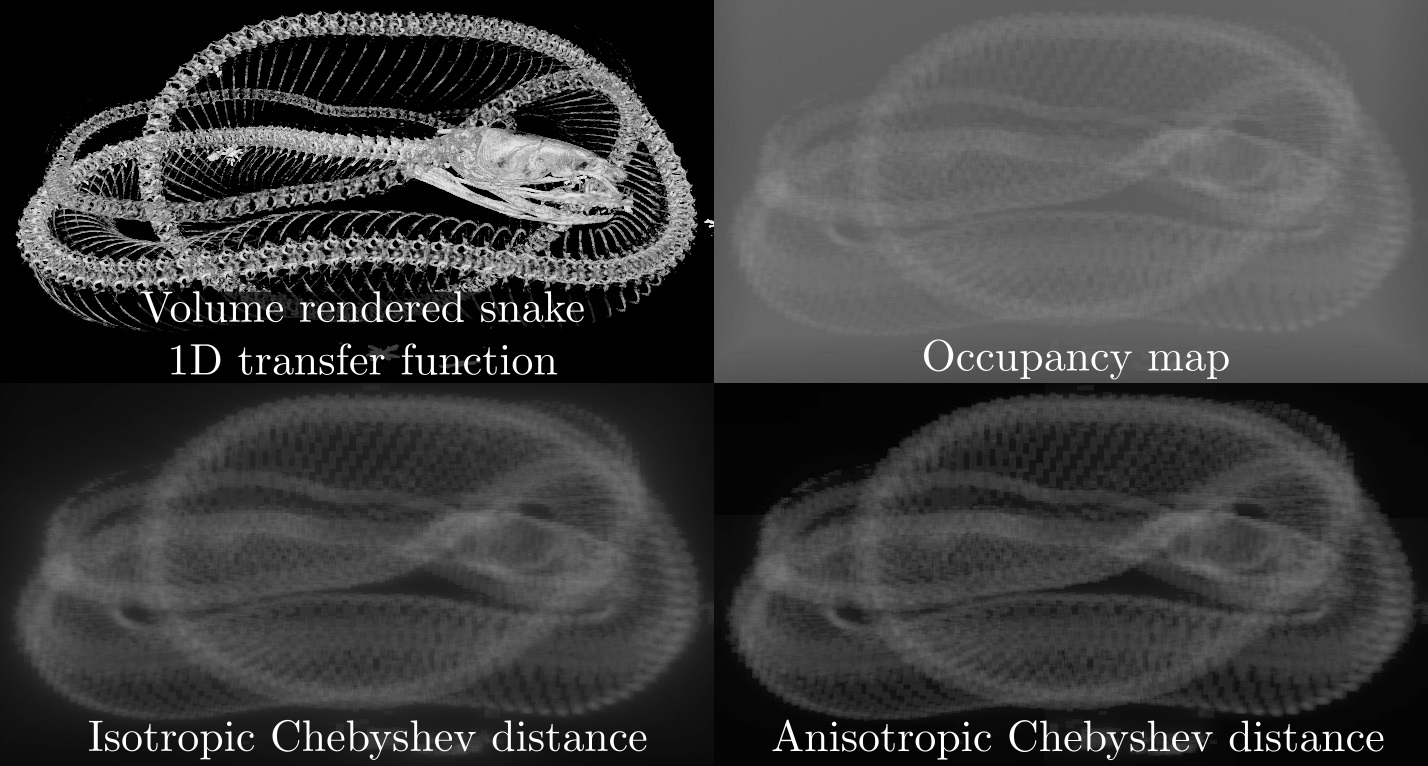
In our previous work we introduced a novel ray traversal technique for rendering large sparse volumetric images at high frame rates. The method relied on the computation of an occupancy and distance map to speed up ray traversal through empty regions.
In this work we achieve higher frame rates than our previous work with an improved method of resuming empty space skipping and the use of anisotropic Chebyshev distance maps. An optimised algorithm for computing Chebyshev distance maps on a graphical processing unit is introduced supporting real-time transfer function editing.
Authors: Deakin L, Knackstedt M
link pdf codeAbstract (97 words)
Authors: Leggat WP, Camp EF, Suggett DJ, Heron SF, Fordyce AJ, Gardner S, Deakin L, Turner M, Beeching LJ, Kuzhiumparambil U, Eakin CM
linkAbstract (235 words)
Authors: Knackstedt M, Deakin L, Milliotte C, Oren PE, Sheppard A, Dance T, Watson M, Dodds K, Heath R
linkAbstract (617 words)
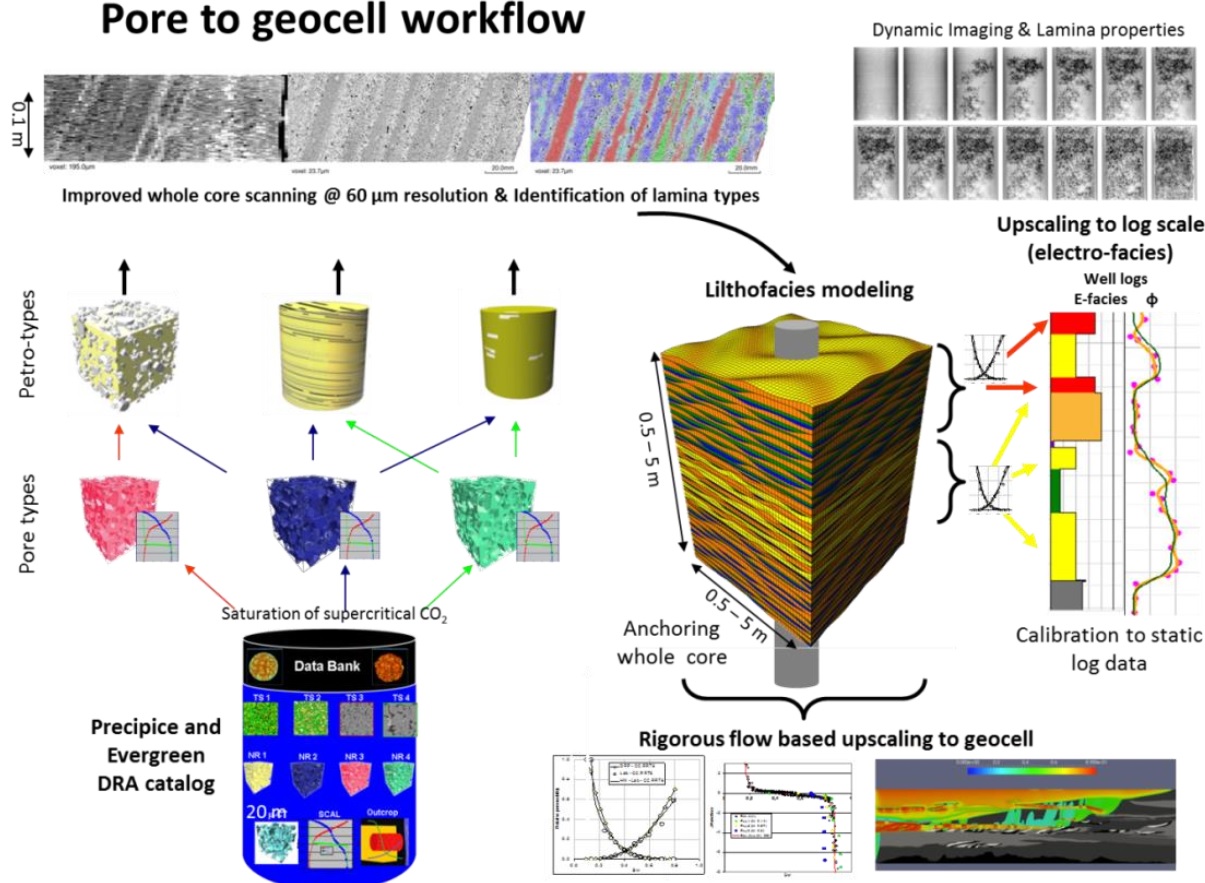
It is well established that small-scale heterogeneities can have a significant impact on the extent of the plume movement within a CCS storage complex. Small-scale heterogeneities cannot be directly incorporated in static and dynamic simulation models because of limitations in computer speed. Therefore, the scale-transgressive effects of small-scale heterogeneities in large-scale numerical simulations (static and dynamic models) must be accounted for through upscaling. Current upscaling techniques do not capture all relevant scales of heterogeneity and only give reliable results for a limited set of scales and flow scenarios. Accurate predictions of multiphase flow require dynamic reservoir models that capture geological heterogeneities and that are populated with representative equivalent static and dynamic flow properties.
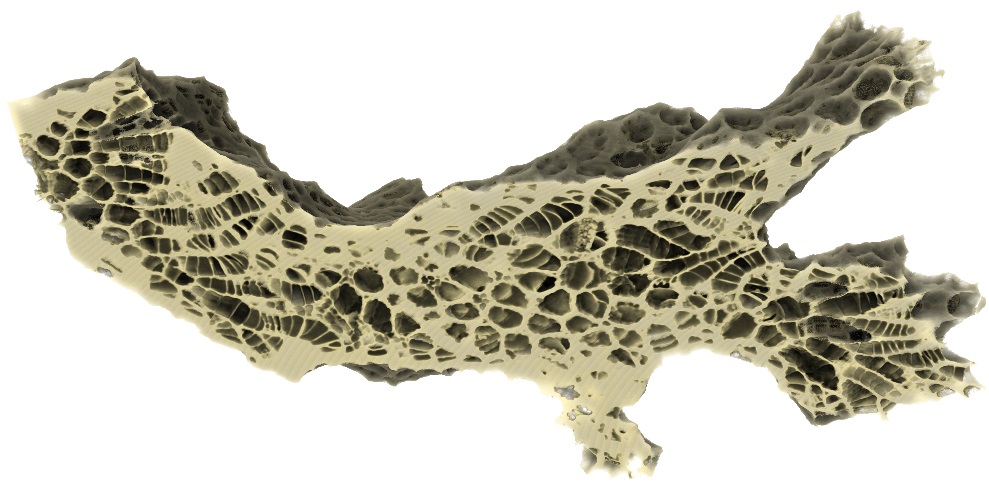
Here we describe the development of a multiscale work program supporting the both the CTSCo Surat and CO2CRC Otway CCS demonstration projects. The study focusses on likely injection intervals in thePrecipice and Paaratte Formation Sandstones which both exhibit complex internal thinly laminated sedimentary features. We describe a workflow based on multiscale 3D imaging calibrated with laboratory and experimental probe analysis which seeks to address the impact of small-scale geological heterogeneity on the static and dynamic rock properties from pore to whole core (foot) scales and beyond. The workflow requires one to extrapolate static and dynamic properties measured at small volumes into a larger volume. The methodology is based on measurement, prediction and anchoring of data at multiple scales. The results of the program illustrate the importance of incorporating realistic geological structures at multiple scales to offer greater confidence in static and multiphase flow predictions at larger – from pore to whole core to geo-model/dynamic model – scales. The multiscale workflow illustrated in the figure includes:
-
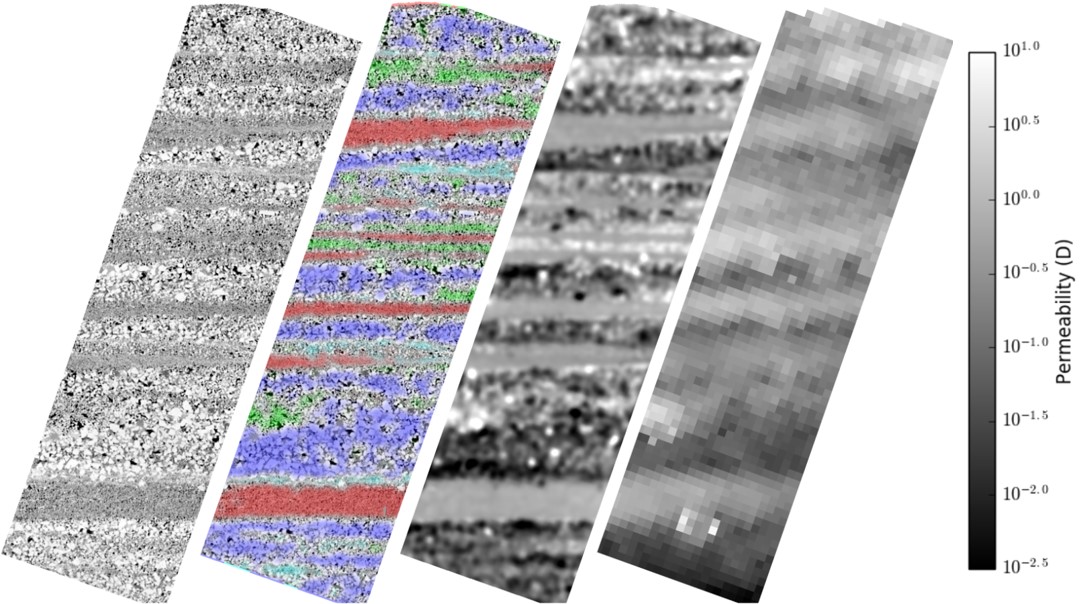
Imaging – improved whole core acquisition to provide a quantitative bridge from pore scale imaging and plug scale measurements to whole core properties and log scale responses. Smaller samples also imaged to characterise pore structure at the highest resolution.
-
Classification – at each scale a novel morphological description of voxelised data is used in a multi-variate clustering analysis (MVCA) to identify the 3D distribution of rock types. This data can be used to locate representative volumes of multiple rock types. Classification at the coarsest (whole core) scale assists in sample selection for experimental measurement or imaging at higher resolution. The process can be repeated at descending scales until the elementary pore structures (individual pores/grains) are captured in 3D.
-
Calibration of Static properties – probe the static properties (permeability, resistivity) at the millimetre scale along continuous slabbed whole core surfaces along meter scales. Comparing the measured values to the ones obtained/predicted from the 3D digital rock modelling and propagation to similar rock types enables one to QC the static property predictions at the whole core scale.
-
Calibration of Dynamic Properties – undertake experimental 3D pore scale SCAL imaging studies on plugs acquired from core samples and image drainage and imbibition at aquifer conditions using time-lapse 3DCT imaging. Generate anchored SCAL data for important reservoir rock types including the generation of trapping curves and tensor-based flow properties – permeability and relative permeability data – on chosen subsamples acquired from whole core samples. Identify potential uncertainties with plug scale data – investigate e.g., impact of wettability, Swi.
-
Populate/Propagate – at a “representative” scale, petrophysical property correlations and saturation dependent properties derived from digital or laboratory data are defined on rock types.
-
Upscaling – extend measurements of static and dynamic properties to the whole core scale – assessing and accommodating the impact of small-scale geological heterogeneity on the static and dynamic rock properties along meter scale lengths of core material. Additionally lithofacies models are developed and populated using object-based geo-modelling tools – this offers a preliminary assessment of impact on larger lateral scales.
Authors: Golab A, Deakin L, Ravlo V, Mattisson C, Carnerup A, Young B, Idowu N, Al-Jeri SA, Al-Rushaid MA
linkAbstract (416 words)
A study was designed to confirm the formation properties obtained from available conventional RCA data and inferred from corrected wireline log data using digital rock analysis (digital RCA and SCAL analysis) on cores from the Greater Burgan field. This study was performed for Kuwait Oil Company, Fields Development Group (S&EK) by FEI Digital Rock Services in 2014.
As part of this study, 27 feet of whole core, from the Lower Ahmadi (AHL2) to Upper Wara (WU1) formations, were imaged by X-ray computed tomography (CT) imaging, including 1 foot of partially preserved core. 14 plugs were extracted from these cores and imaged in 3D by a high resolution helical micro-CT. Analysis revealed stark differences in mineralogy, grain size and sorting and the presence of severe fracturing in some plugs due to the fragility and friability of the rock.
Sub-plugs were extracted from 10 of the 14 plugs (including one sub-plug from the partially preserved section) and imaged in 3D by helical micro-CT. 7 of the sub-plugs proved suitable for digital RCA and SCAL analysis. The 3D images were used to calculate digital RCA properties (porosity, permeability, grain density, grain size distribution and formation factor) and pore network models were built to perform digital SCAL simulations and predict multiphase transport properties such as Pc, kr and resistivity index for primary drainage and imbibition.
In addition, the in situ mineralogy of each plug was analysed using 2D SEM-EDS automated, quantified mineral mapping. The mineral maps, combined with BSEM images, contain rich textural information and were registered into perfect geometric alignment with the 3D micro-CT images.
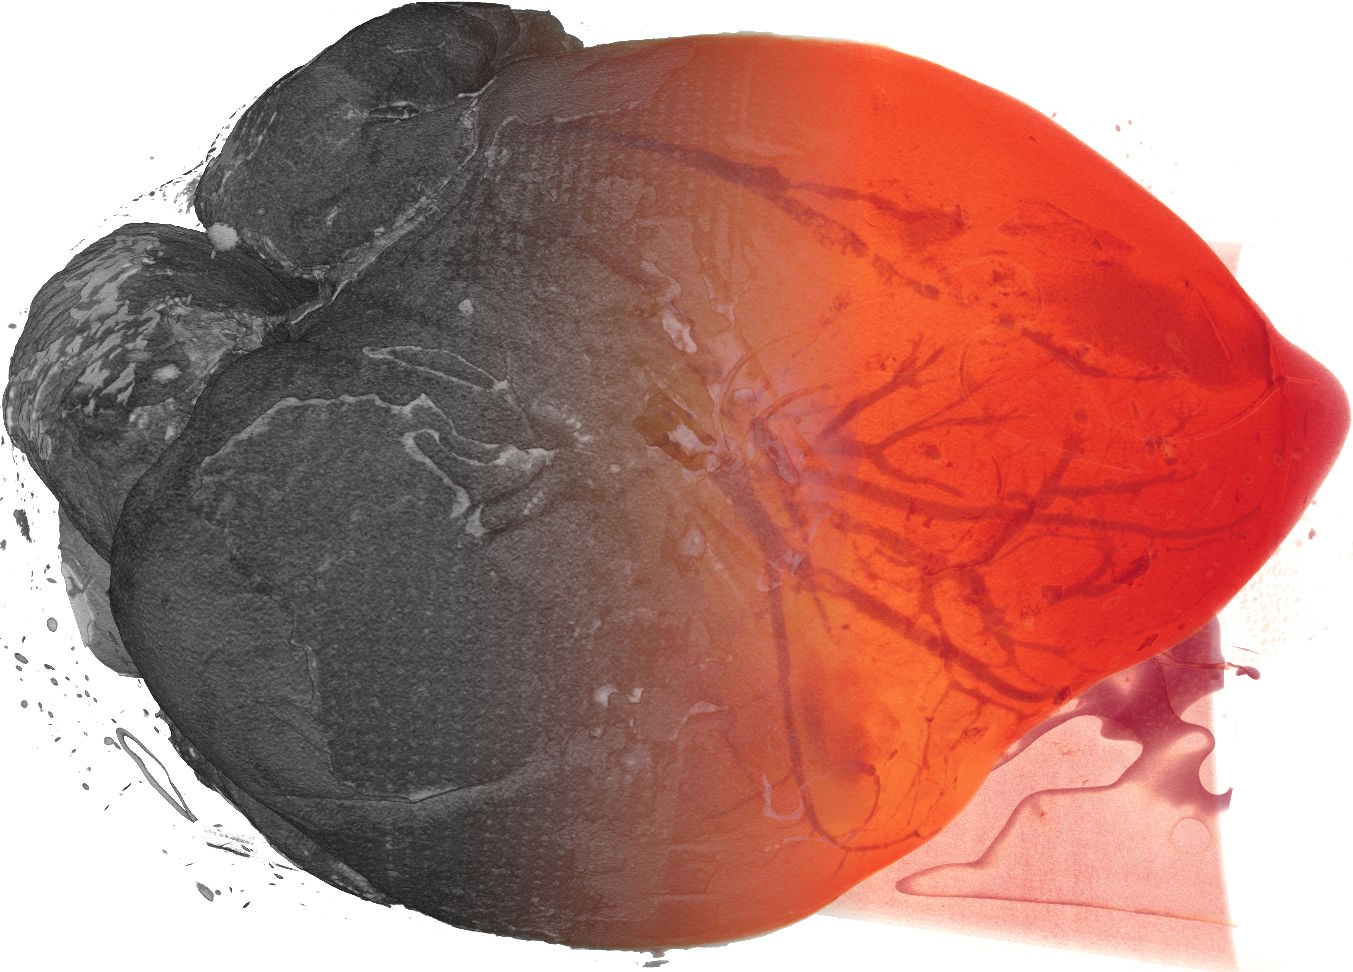
A tight rock workflow was used to identify sub-resolution porosity in 3 of the plugs. Experimental MICP curves showed that substantial portions of the pore throats were below the image resolution, caused by large amounts of pore-filling materials. Hence, pore scale information could not be directly extracted from some images. Consequently, process based modelling was carried out on two plugs to generate pore-networks. A quasi-static pore-network model was used to simulate oil/water displacements and predict multiphase transport properties. Detailed imaging of oil-in-place and porosity was performed on a partially preserved plug to create a map of remaining oil which revealed that oil was retained in most porous grains and strongly retained in clay-rich zones.
The digital core analysis results are in agreement with available log and core data. The Lower Ahmadi (AHL2) section is good quality in terms of porosity, permeability and flow properties, whereas the Upper Wara (WU1) section is of poorer quality.
Authors: Deakin L, Sok R, Bhattad P, Knackstedt M
linkAbstract (313 words)
Engineers Australia ITEESPAN 2013 Winner
pdf videoAbstract (240 words)
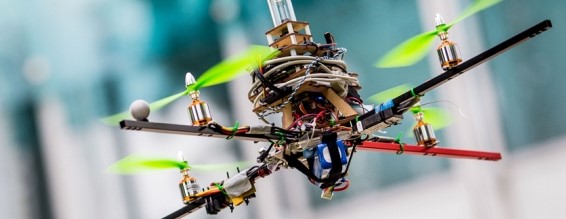
The objective of this study was to develop low-cost, robust and accurate sensor systems on a quadrotor for the implementation of a sensor-based vehicle formation control algorithm. The algorithm was recently developed at the ANU and was only ever tested in simulation.
A new quadrotor was assembled and mounted with a custom omnidirectional vision system to acquire bearings measurements of other vehicles. A custom omnidirectional lens was used which had a better vertical field of view compared with tested commercial solutions. The vision system, coupled with an efficient marker detection algorithm, detected bearings of other vehicles at 55Hz with a typical error of less than 5◦ in azimuth and elevation.
A widely used driver package for the Vicon motion capture system was modified to provide robust velocity measurements over a poor wireless channel. This was experimentally evidenced by a significant reduction in variability of velocity measurements when compared with a previously used method. An adaptation to the formation control algorithm was proposed which could function without velocity measurements for system damping and its performance was verified in simulation.
The robustness and accuracy of these key sensor measurements was demonstrated in a flight test where the quadrotor was flown under manual control. Support for offboard control was added to the flight controller so that the vehicle could be controlled by the vision system. Unfortunately, the quadrotor was not flown under the control of the formation control algorithm because of time constraints.